Monitoring NGINX logs with Dockerized Logdy
Creating a searchable and filterable presentation of NGINX access.log with Logdy, dockerized
While recently trying to diagnose nginx+crowdsec issues I discovered Logdy, a web-based log browser that makes parsing and presenting plain text logs as rich data criminally easy.
Here’s how I am using it, as a dockerized app, to monitor nginx access.log.
Dockerized Logdy
Logdy was not originally designed to work in a Docker container but thanks to some intrepid users it at least now has a Dockerfile (but not a published image).
No problem, though, we can use the Dockerfile remotely. We’ll start with a bare-bones stack and add to it as we setup Logdy.
1
2
3
4
5
6
7
8
9
10
11
12
13
14
15
16
services:
  swag-logs:
    build:
      # may want to pin to a commit
      context: https://github.com/logdyhq/logdy-core.git
    read_only: true
    volumes:
      - /host/path/to/nginx/log:/var/log:ro
    ports:
      - "8080:8080"
    command:
      - "follow"
      - "/var/log/access.log"
    restart: unless-stopped
    security_opt:
      - no-new-privileges=true
Start up the stack and visit localhost:8080. Hooray! Logdy is started and displaying our logs in real-time. Unfortunately, its only displaying each line raw (as seen in the actual log), which isn’t very helpful.
Parsing Logs
If your logs are already formatted as json then Logdy can auto generate columns based on property keys in the log object.. Logdy even has a tutorial on setting up nginx to output json for this very convenience.
However, our logs are plain text using the default format and we want to keep it this way so that logs are readable with a plain tail view. To turn our logs in json, then, we will create a middleware that transforms our plain text line into json_content on the line object. The Logdy blog has a good starter tutorial on how to do this for nginx but we are going to take it further.
Middleware
In Logdy, open the settings (Cog icon) in the top-right corner and Add a new Middleware. Give it a name. The below snippet is our middelware code for transforming our log line. Make sure to read it through and edit it as needed for your use-case.
1
2
3
4
5
6
7
8
9
10
11
12
13
14
15
16
17
18
19
20
21
22
23
24
25
26
27
28
29
30
31
32
33
34
35
36
37
38
39
40
41
42
43
44
45
46
47
48
49
50
51
52
53
54
55
56
57
58
59
60
61
62
63
64
65
66
67
68
69
70
71
72
(line: Message): Message | void => {

    const logPattern = /^(\S+) (\S+) (\S+) \[([^\]]+)\] "(\S+) (\S+) (\S+)" (\d+) (\d+) "([^"]+)" "([^"]+)"(?: (?:"([^"]+)")(?: "([^"]+)")?)?/;
    const logMatches = line.content.match(logPattern);

    // is the requesting IP outside our internal network?
    let external = true;
    // is the requesting IP my machine?
    let me = false;

    if (logMatches) {

        // set to ipv4/v6 matchers for your internal network
        // if you don't care about this just set to true
        external = !logMatches[1].includes('192.168.1') && logMatches[1] !== "2600:1700:myip:v6Matcher";

        // set to ipv4/v6 matchers for your IP
        // if you don't care about this just set to true
        me = logMatches[1] === "192.168.1.XXX" || logMatches[1] === "2600:1700:myip:v6Matcher";

        const urlPattern = /^(?:([A-Za-z]+?):\/\/)?(?:[^@\n]+@)?(?:([A-Za-z]+?)\.)?([^:\/\n?]+)(.*)/;

        let hostname = '-',
            subdomain = '-',
            host = logMatches[12] ?? '-',
            uaUrl;

        if (host !== '-') {

            const urlMatch = host.match(urlPattern);

            if (urlMatch) {
                if (urlMatch[3].includes('.')) {
                    subdomain = urlMatch[2];
                    hostname = urlMatch[3];
                } else {
                    hostname = `${urlMatch[2]}.${urlMatch[3]}`;
                }
            }
        }

        const regUrlPattern = /\+([(http(s)?):\/\/(www\.)?a-zA-Z0-9@:%._\+~#=]{2,256}\.[a-z]{2,20}\b([-a-zA-Z0-9@:%_\+.~#?&//=]*))/;
        const uaMatch = logMatches[11].match(regUrlPattern);
        if (uaMatch) {
            uaUrl = uaMatch[1];
        }

        line.is_json = true
        line.json_content = {
            ip: logMatches[1],
            dash1: logMatches[2],
            dash2: logMatches[3],
            timestamp: logMatches[4],
            method: logMatches[5],
            path: logMatches[6],
            protocol: logMatches[7],
            status: parseInt(logMatches[8]),
            bytesSent: parseInt(logMatches[9]),
            subdomain,
            hostname,
            referer: logMatches[10],
            userAgent: logMatches[11],
            uaUrl,
            external: external ? 'true' : 'false',
            me: me ? 'true' : 'false',
            host,
            scheme: logMatches[13]
        };
    }

    return line;
}
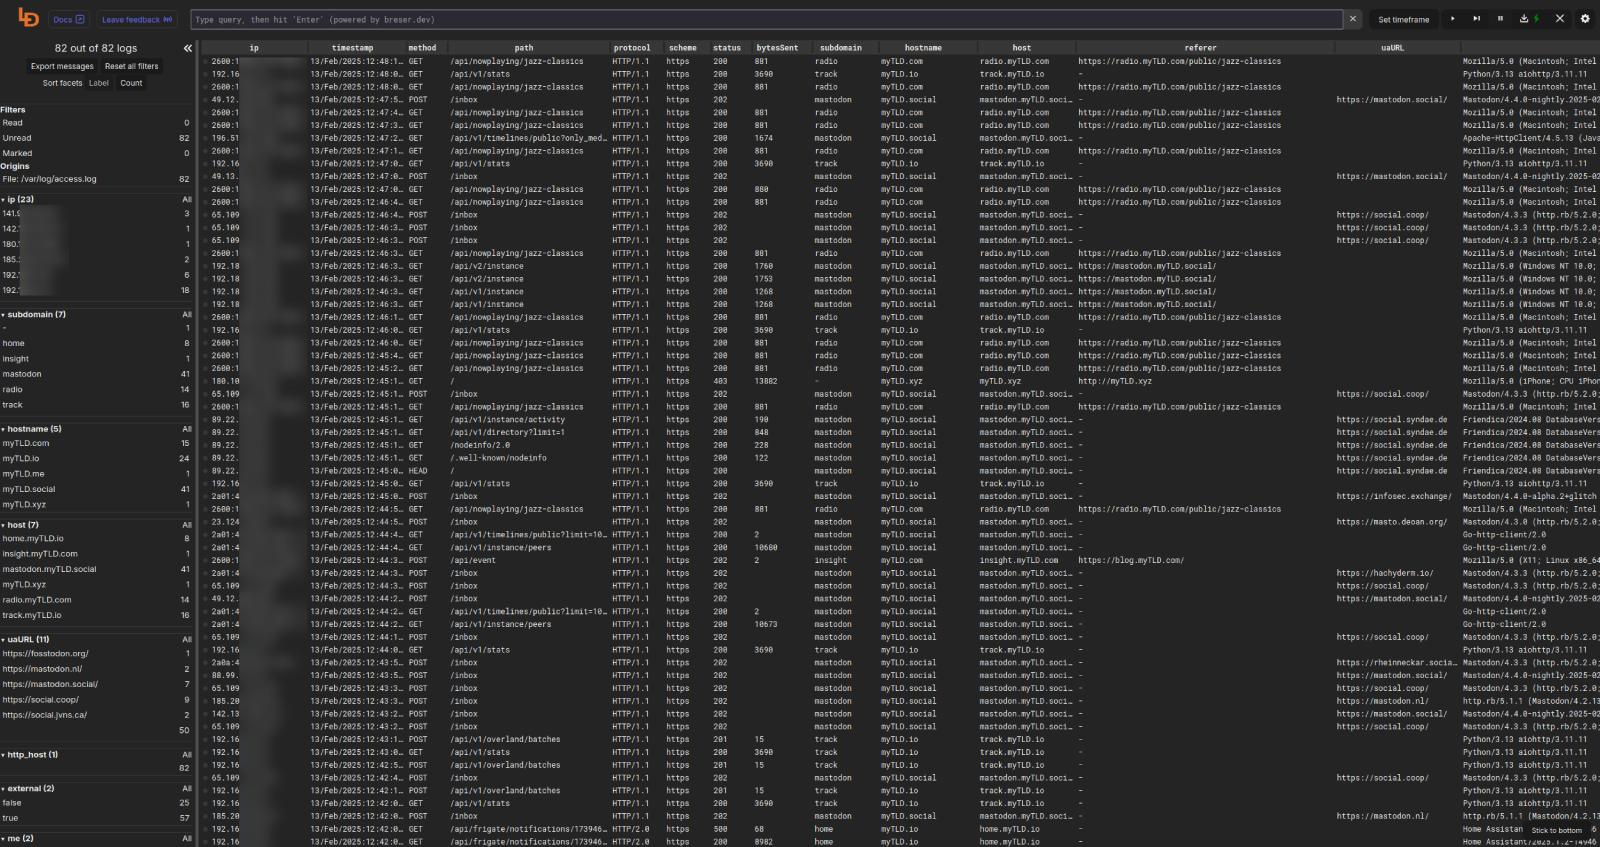
Now Save Middleware and then Save Settings. Then, you can use Columns Auto-generate to create columns from the parsed lines.
Neat! We’ve got columns and our logs displays has been updated with them.
Make sure to Save Settings again and then close the settings drawer.
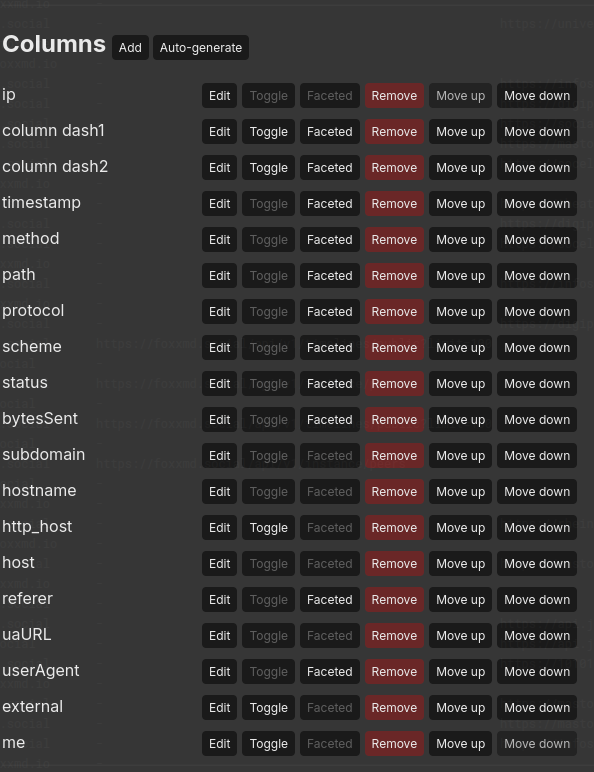
Customizing Columns
Now, you probably want to set up Facets so that columns can be enmuerated and easily filtered from the left sidebar. Simply click on/off the Faceted button on the column you want, inside the settings drawer, and save once you have it configured as you’d like.
Persisting Settings
A problem remains, though. The middleware and column customization we’ve done is ephemeral. If you refresh the page everything will be gone! So now we need to save our settings and let Logdy know to use them on page load.
In the settings drawer open Export/Import and then Save as file. Save the file somewhere to the machine that is running the logdy docker container.
Next, we will modify our docker stack to include our saved config:
1
2
3
4
5
6
7
8
9
10
11
12
13
14
15
16
17
18
19
20
21
services:
  swag-logs:
    build:
      # may want to pin to a commit
      context: https://github.com/logdyhq/logdy-core.git
    read_only: true
    volumes:
      - /host/path/to/nginx/log:/var/log:ro
      # add config path file
      - /host/path/to/logdy/config/file.json:/config/logdy.json
    ports:
      - "8080:8080"
    command:
      # add config to command args
      - "--config"
      - "/config/logdy.json"
      - "follow"
      - "/var/log/access.log"
    restart: unless-stopped
    security_opt:
      - no-new-privileges=true
Now, when the container is recreated it will use the settings we saved! If you need to iterate on your settings repeat the process…export to file -> copy to docker host config location -> restart Logdy.
Turnkey NGINX Settings
If you’d rather skip making your own middleware and tweaking settings you can download this file to use a logdy settings. It already has everything configured. Just make sure to edit external and me in middleware and persist your settings, if you care about that.
Enhancing NGINX Logs
You may have noticed some of the columns are empty. That’s because the default nginx log format does not include host and scheme information.
The exact instructions for modifying your ngninx instance are out of scope for this post but in short…
Make sure logging is already setup. You may want to have it defined globally (in http block) to take full advantage of this change.
Create a new log format that extends the default:
1
2
3
log_format extended '$remote_addr - $remote_user [$time_local] '
                '"$request" $status $body_bytes_sent '
                '"$http_referer" "$host" "$scheme"';
Define your access_log directive to use the custom format:
1
access_log /config/log/nginx/access.log extended;
And now you’ll get those extra columns populated in Logdy.